Slope-intercept form: graph an equation
T.6 Slope-intercept form: graph an equation by Delta publications
Key Notes:
Definition
The slope-intercept form of a linear equation is:
y = mx + b
Where:
- m = slope of the line (rise over run)
- b = y-intercept (the point where the line crosses the y-axis)
Understanding the Slope (m)
- Slope = change in y / change in x = rise / run
- Positive slope → line rises from left to right
- Negative slope → line falls from left to right
- Zero slope → horizontal line
- Undefined slope → vertical line (not in slope-intercept form)
Understanding the Y-intercept (b)
- Point where the line crosses the y-axis
- Coordinates are always (0,b)
Steps to Graph an Equation in Slope-Intercept Form
- Identify the slope (m) and y-intercept (b) from the equation.
- Plot the y-intercept on the y-axis.
- Use the slope to find another point:
- From the y-intercept, move rise units up/down and run units right.
- Draw the straight line through the points.
- Extend the line and label it.
Example
Equation: y = 2x − 3
- m = 2 → rise = 2, run = 1
- b = -3 → y-intercept = (0, -3)
Graphing:
- Plot (0, -3)
- From (0, -3), go up 2 and right 1 → (1, -1)
- Draw line through the points.
Key Points to Remember
- Slope is a measure of steepness.
- Y-intercept tells where the line starts on the y-axis.
- Only two points are needed to draw a line, but more points can make it accurate.
- Always check if the equation is in y = mx + b form; if not, rearrange it.
Learn with an example
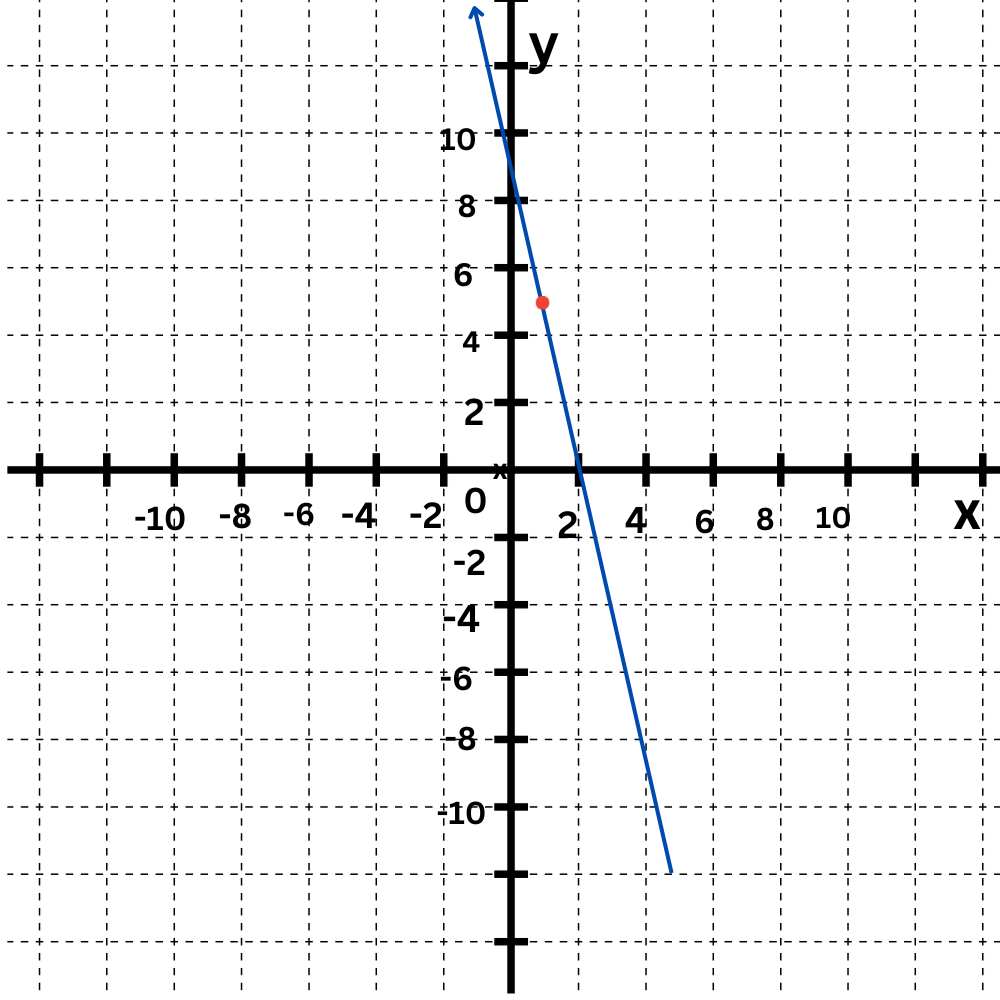
Graph this line using the slope and y-intercept:
y = –5x + 10
The graph is the straight line connecting ( 0,10 ) and ( 1,5 ).
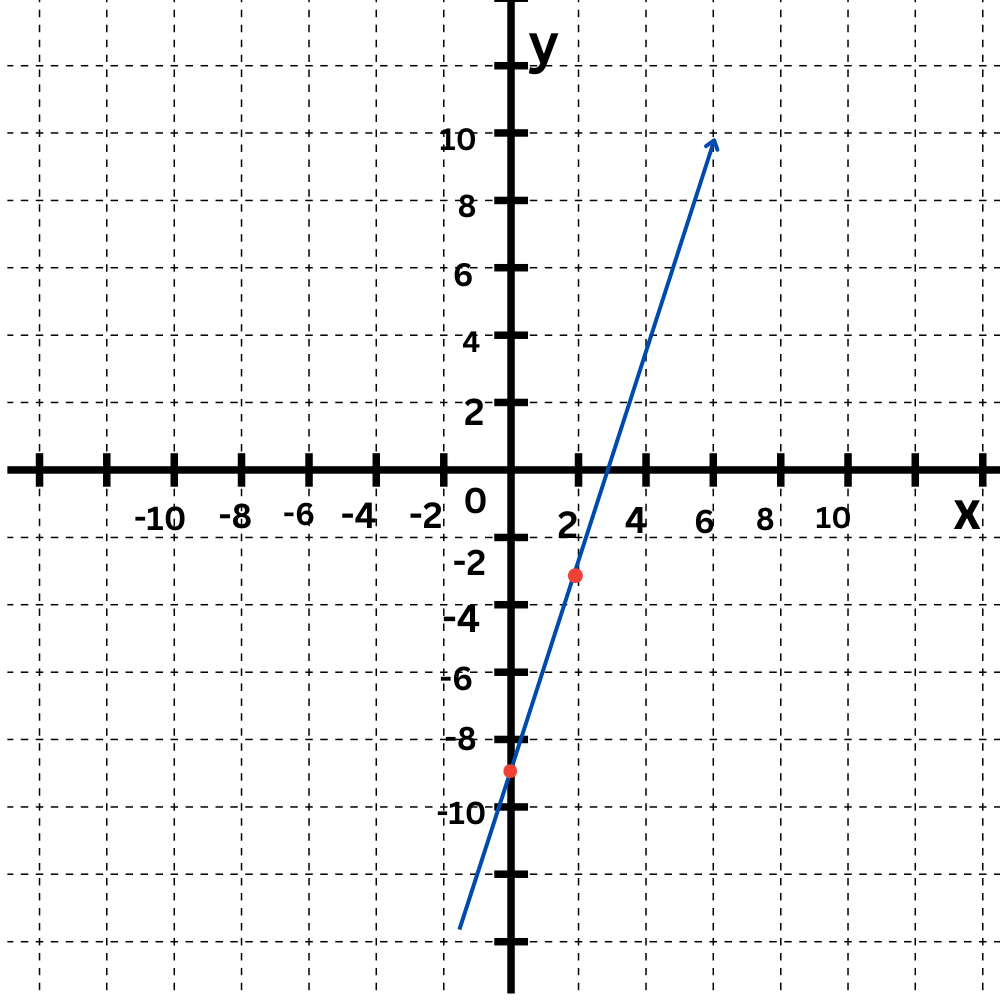
Graph this line using the slope and y-intercept:
y = 6x -9
The graph is the straight line connecting ( 0,-9 ) and ( 1,-3 ) .
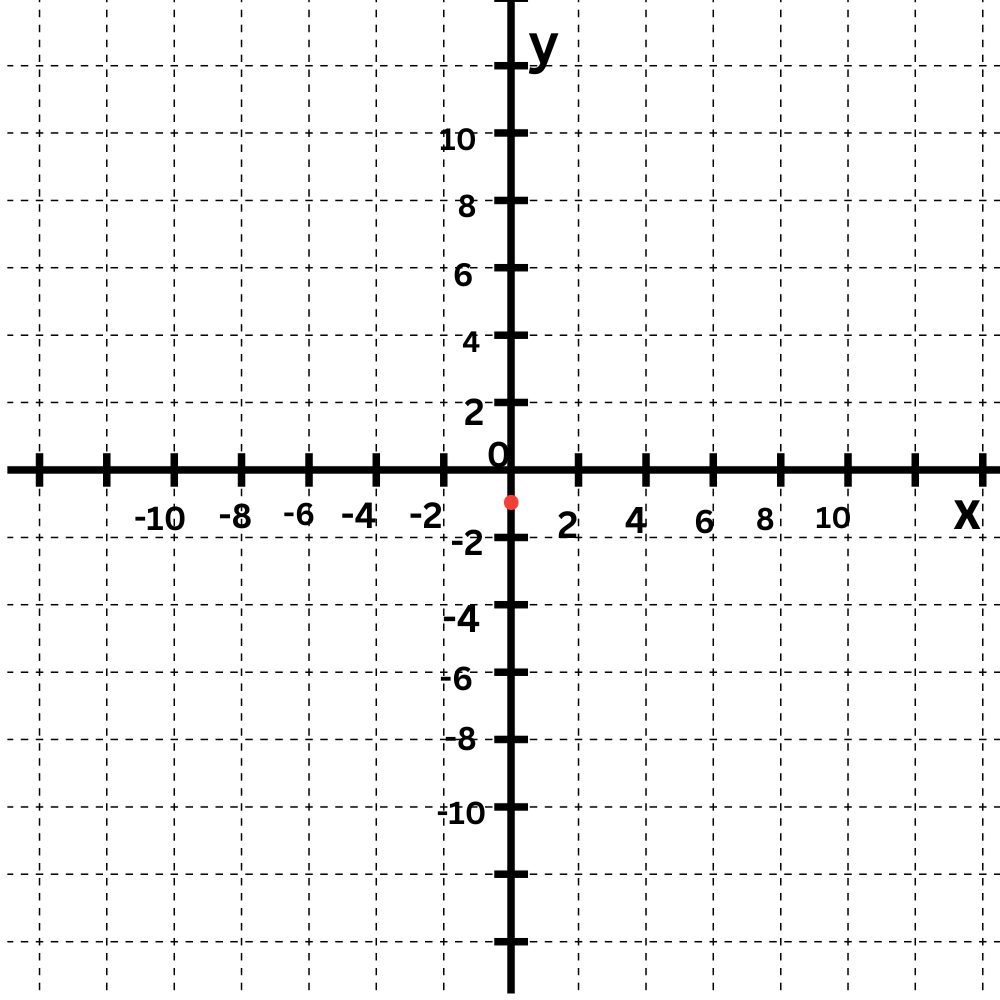
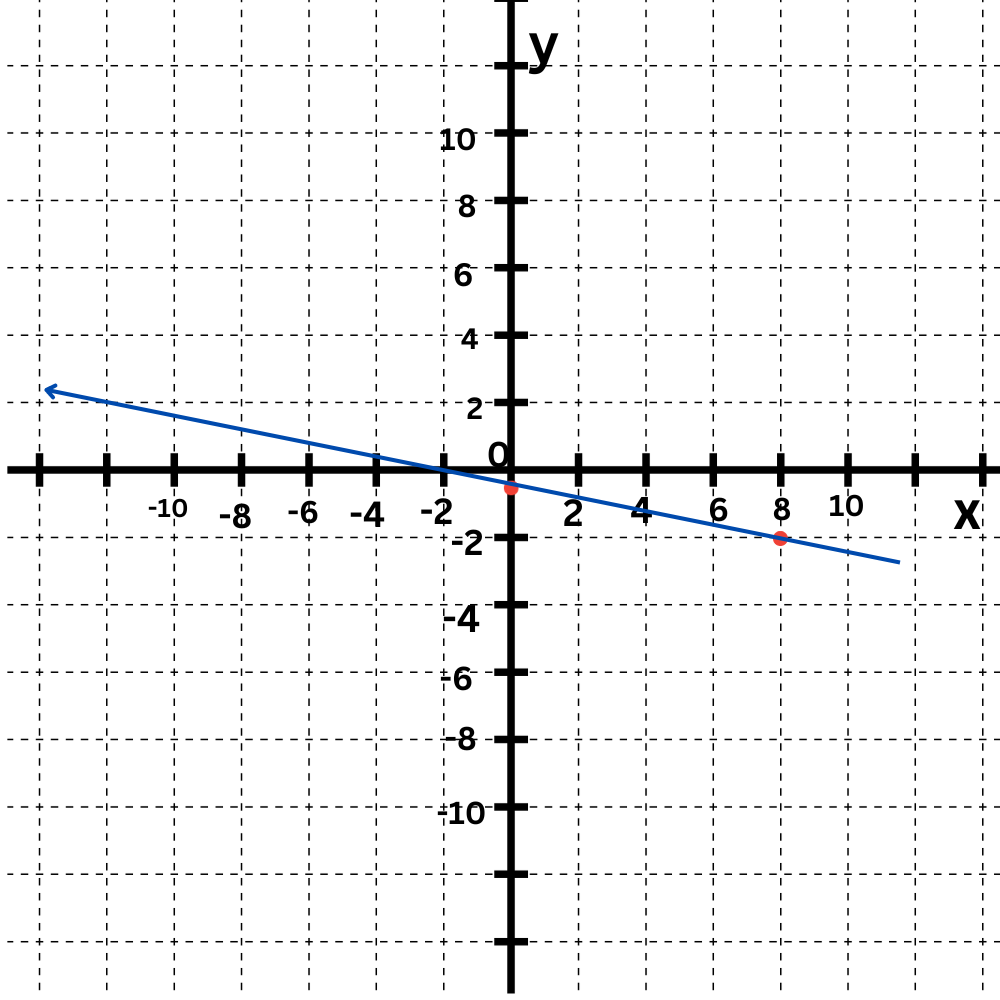
Graph this line using the slope and
y-intercept:
y = -1/8x – 1
Click to select points on the graph.
The y-intercept is -Plot the point (0, -1 ) .
The slope is -1/8 . Move down 1 and right 8 to find another point on the line.
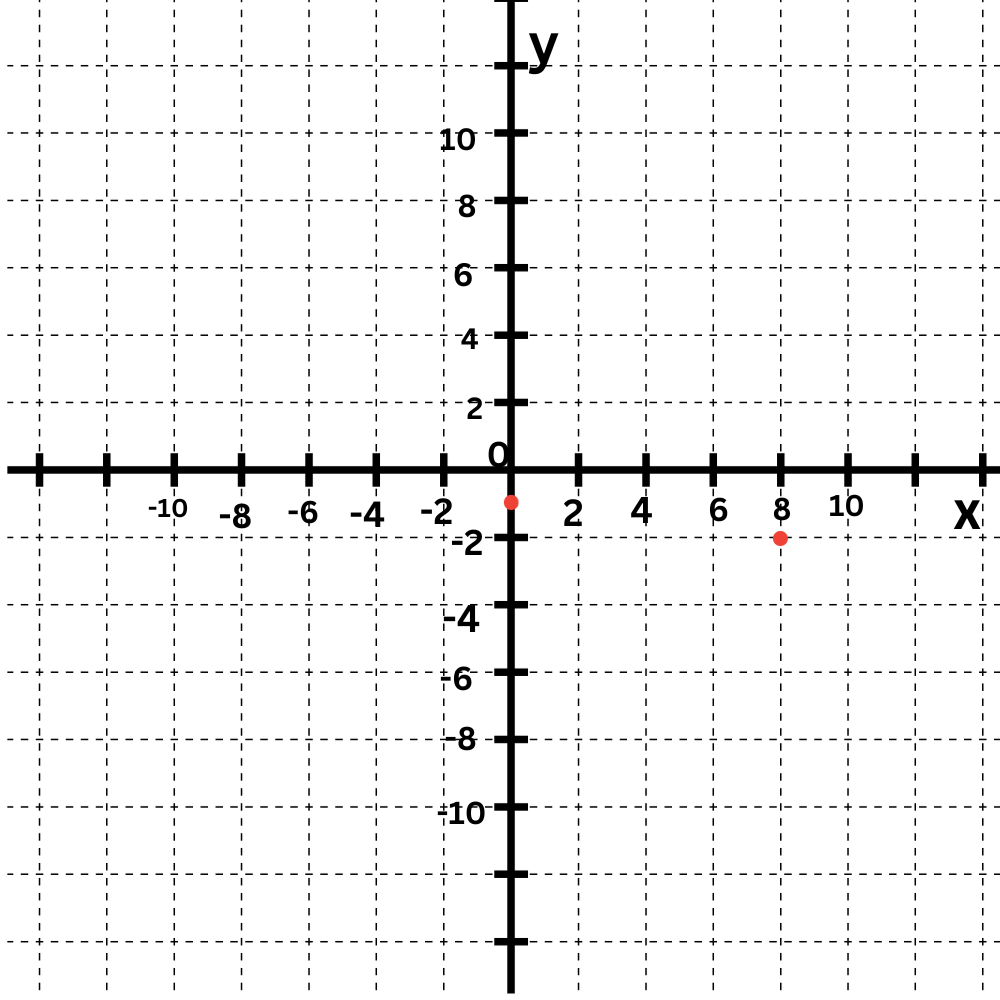
The graph is the straight line connecting (0,1) and (8, -2).
Let’s Practice!