Graph a horizontal or vertical line
Key notes
Introduction
In coordinate geometry, horizontal and vertical lines are special types of straight lines that are easy to graph because their equations are simple.
Horizontal Lines
Definition:
A horizontal line runs left to right and is parallel to the x-axis.
Equation form:
y=c
where c is a constant (a fixed number).
Characteristics:
- The y-coordinate is always the same for every point on the line.
- The slope of a horizontal line is 0.
Example:
Equation: y=3
This means the line passes through all points where y = 3, such as (0,3), (2,3), (−4,3), etc.
Graphing steps:
- Draw a horizontal line passing through y = 3 on the y-axis.
- The line extends infinitely left and right.
Vertical Lines
Definition:
A vertical line runs up and down and is parallel to the y-axis.
Equation form: x=k where k s a constant (a fixed number).
Characteristics:
- The x-coordinate is always the same for every point on the line.
- The slope of a vertical line is undefined.
Example:
Equation: x=−2
This means the line passes through all points where x = −2, such as (−2,0), (−2,5), (−2,−3), etc.
Graphing steps:
- Draw a vertical line passing through x = −2 on the x-axis.
- The line extends infinitely up and down.
Summary Table
| Type of Line | Equation | Slope | Description |
|---|---|---|---|
| Horizontal line | y=c | 0 | Parallel to x-axis |
| Vertical line | x=k | Undefined | Parallel to y-axis |
Practice Questions
- Graph the line y=4 on the coordinate plane.
- Graph the line x=−1 on the coordinate plane.
- Identify if the line y=−5 is horizontal or vertical.
- What is the slope of the line x=0?
Learn with an example
Graph this equation:
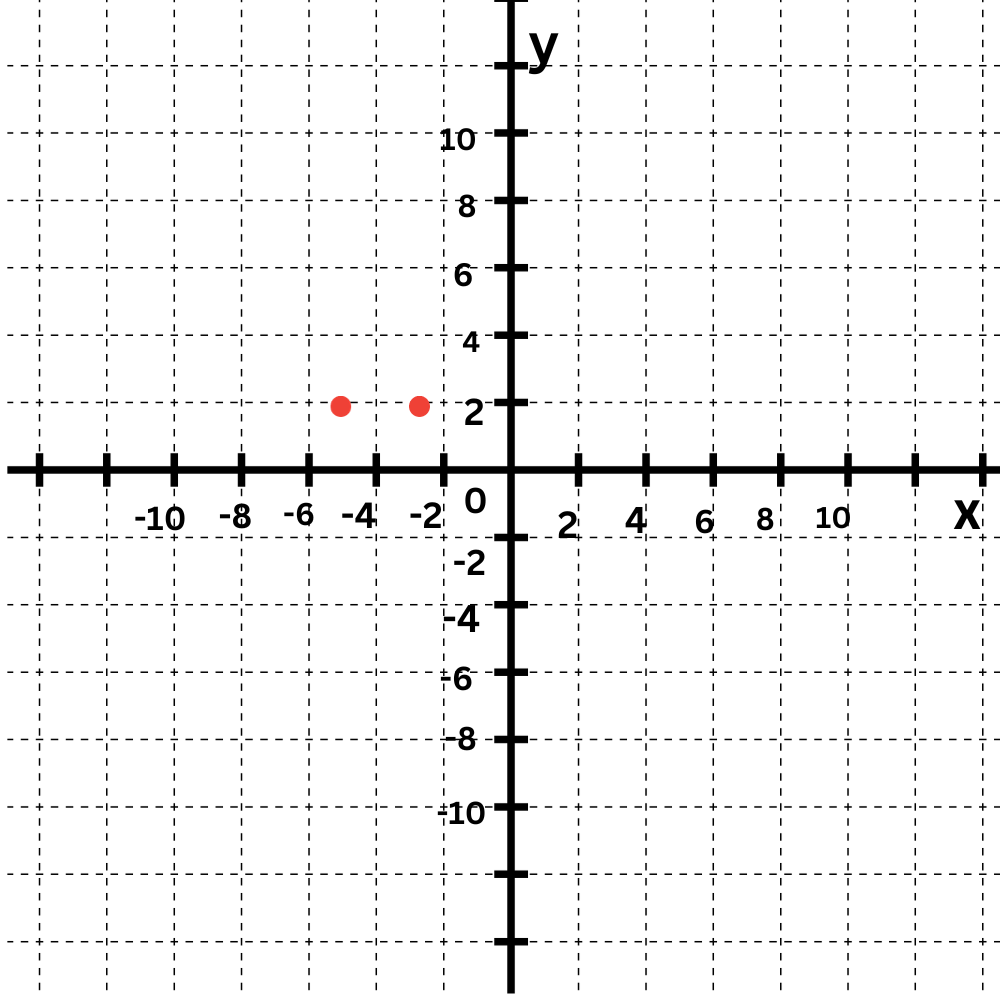
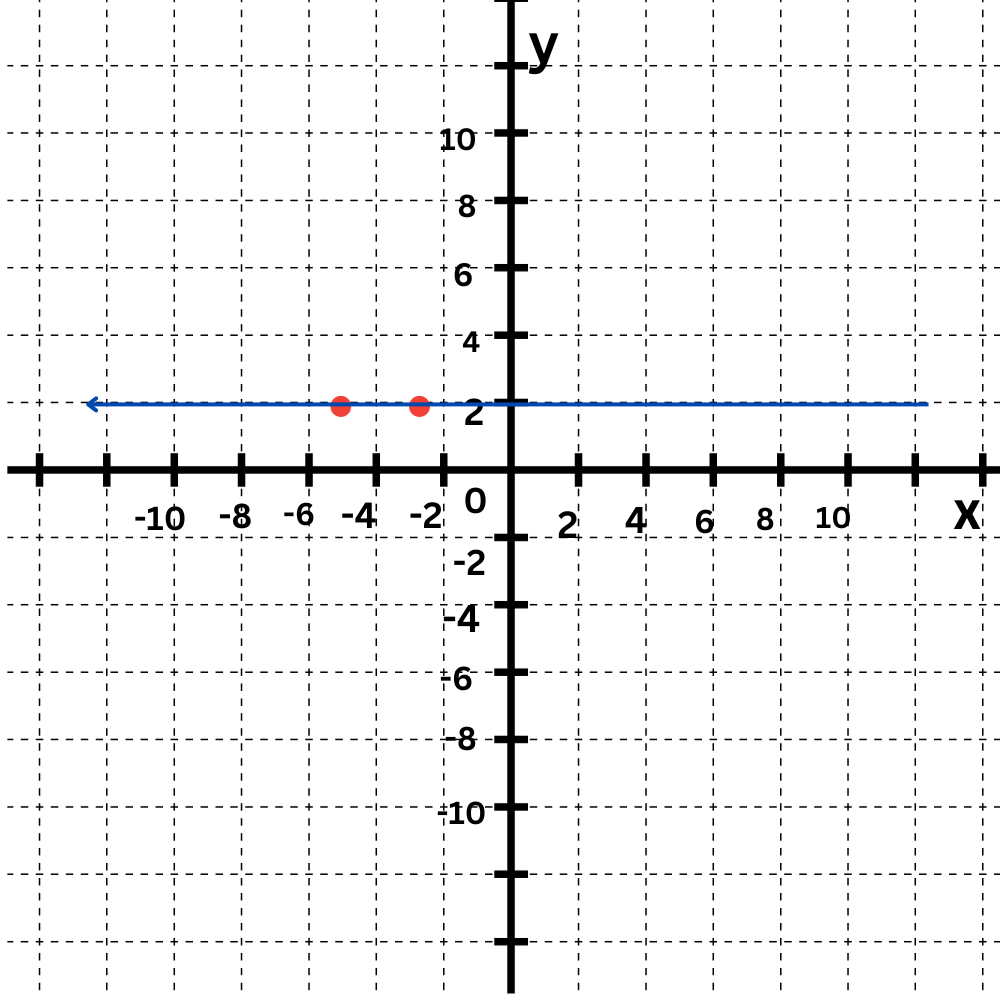
y=2
Click to select points on the graph.
The equation y=2 tells you that every y-value is 2.
First plot some points that have a y-value of 2, such as (–3,2) and (–1,2).
Now draw a line connecting the points.
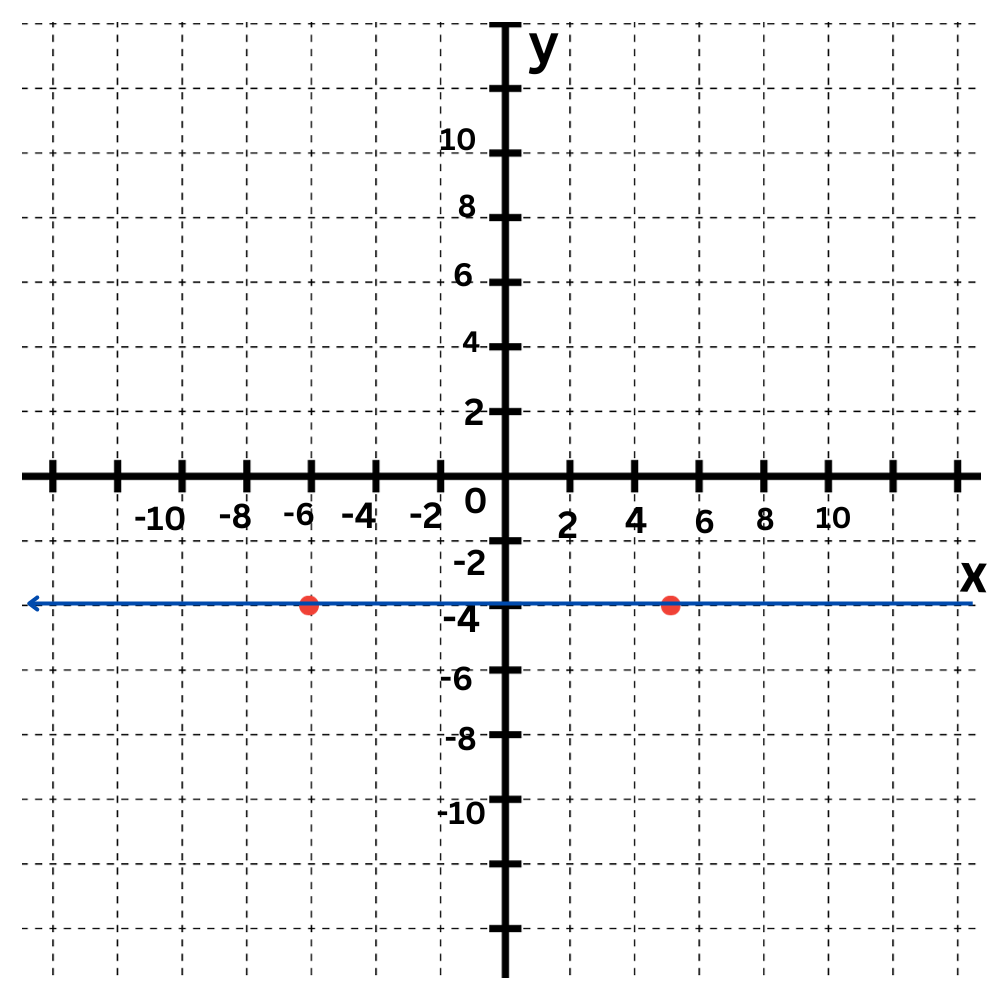
Graph this equation:
Click to select points on the graph
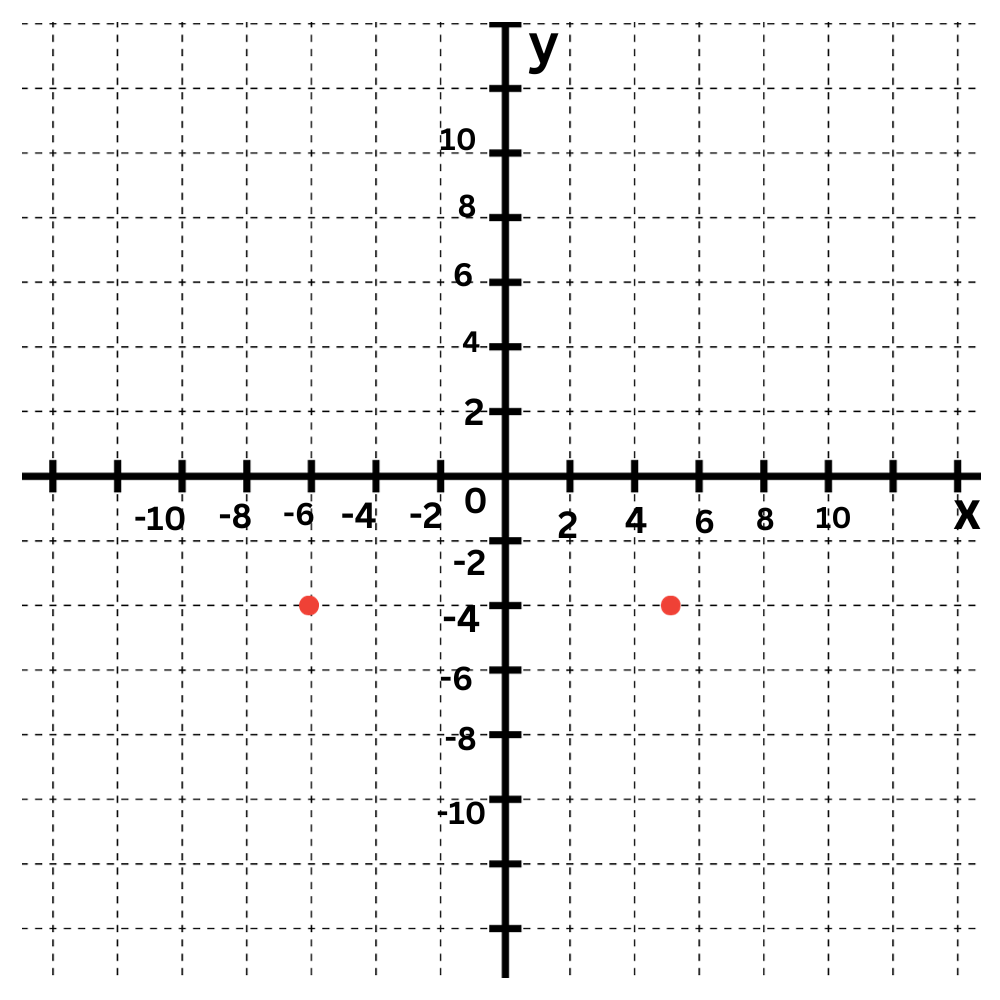
y=–6
💡The graph of y=–6 is a horizontal line. Every y-value is –6, including the y-intercept.
The equation y=–6 tells you that every y-value is –6.
First plot some points that have a y-value of –6, such as (–4,–6) and (5,–6).
Now draw a line connecting the points.
Let’s Practice!