Standard form: graph an equation
key notes:
Standard Form Reminder
A linear equation in standard form looks like this:
Ax+By=C
where A, B, and C are integers (no fractions), and x,y are variables.
Why Use Intercepts to Graph?
- Easy and fast method
- Just find where the line crosses the axes
- Only need two points to draw the whole line!
Step-by-Step Guide to Graph Using Intercepts
| Step | What to do | How to do it | Result |
|---|---|---|---|
| 1 | Find x-intercept | Set y=0 in Ax+By=C solve for x | Point (x,0) |
| 2 | Find y-intercept | Set x=0 in Ax+By=C, solve for y | Point (0,y) |
| 3 | Plot both points | Mark (x,0)) and (0,y) on graph paper | Visual points |
| 4 | Draw the line | Use a ruler to connect points | Straight line graph |
Example: Graph 2x+3y=12
- Find x-intercept:
Set y=0
2x=12 ⟹ x=6
Point: (6,0)
- Find y-intercept:
Set x=0
3y=12 ⟹ y=4
Point: (0,4)
- Plot points (6,0) and (0,4) on the graph paper.
- Draw a straight line through them.
Tips for Success
- Always check both intercepts before plotting.
- If intercepts are fractions, multiply the whole equation by the denominator to clear them.
- When A=0 or B=0 the line is either horizontal or vertical:
- If A=0, equation is By=C → horizontal line y=C/B.
- If B=0, equation is Ax=C→ vertical line x=C/A.
Practice
Graph these equations:
1. 3x+4y=12
2. 5x−2y=10
3. x+y=7
4. 6x=18
5. 4y=8
Learn with an example
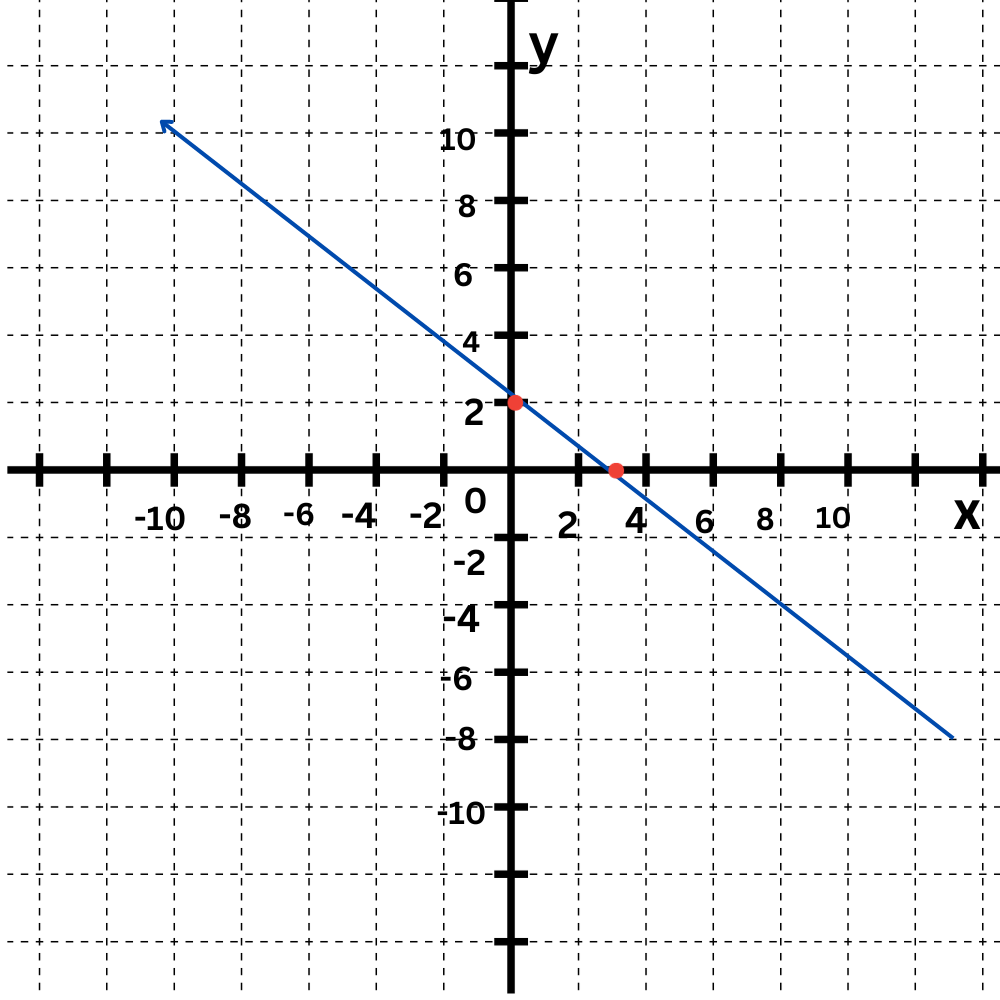
Graph this line using intercepts:
2x+3y = 6
Step 1: Find the x-intercept.
The x-intercept is on the x-axis, where y=0. Plug y=0 into the equation and solve for the x-intercept x.
2x+3y=6
2x+3(0)=6 Plugin y=0
2x=6
x=3
The x-intercept is 3. Its coordinates are (3,0).
Step 2: Find the y-intercept.
The y-intercept is on the y-axis, where x=0. Plug x=0 into the equation and solve for the y-intercept y.
2x+3y=6
2(0)+3y=6 Plug in x=0
3y=6
y=2
The y-intercept is 2. Its coordinates are (0,2).
Step 3: Use the intercepts to graph.
Plot the x-intercept (3,0) and the y-intercept (0,2). The graph is the straight line connecting them.
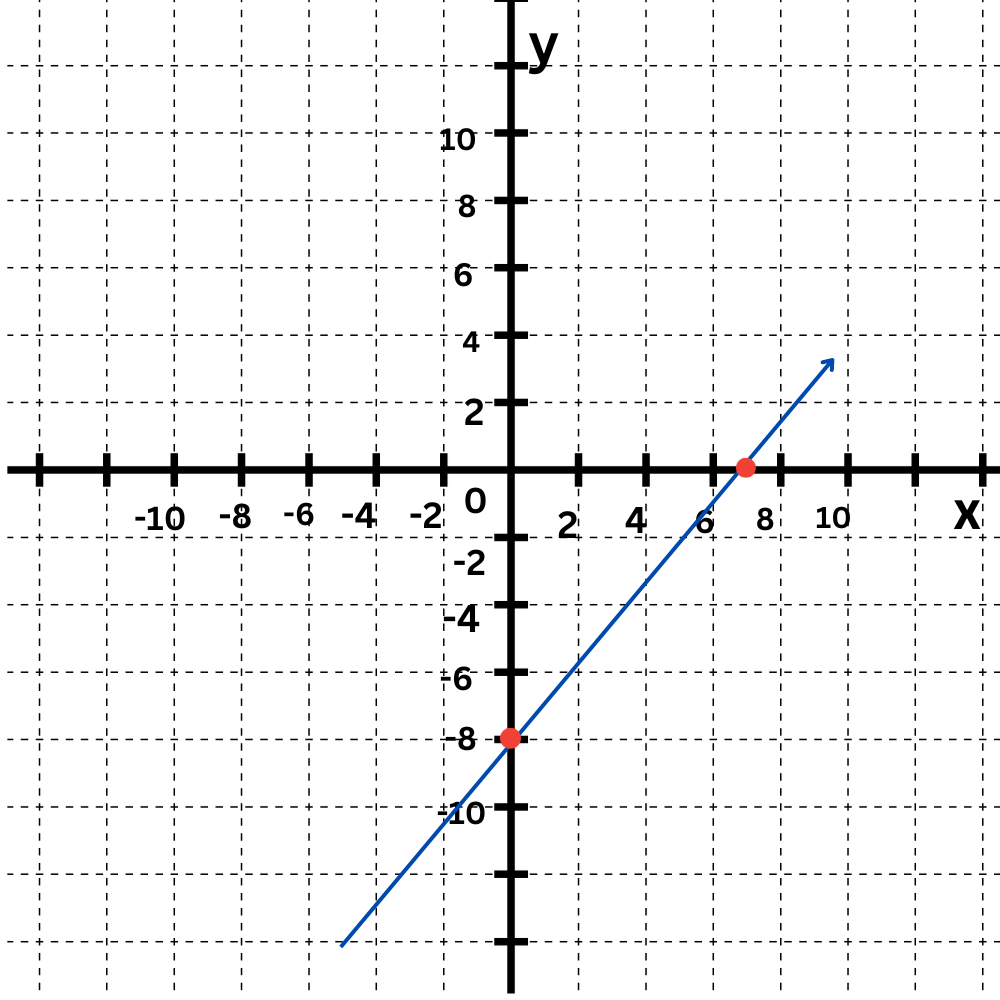
Graph this line using intercepts:
8x–7y=56
Click to select points on the graph.

Step 1: Find the x-intercept.
The x-intercept is on the x-axis, where y=0. Plug y=0 into the equation and solve for the x-intercept x.
8x–7y= 56
8x–7(0) = 56 Plug in y=0
8x = 56 Simplify
x= 7 Divide both sides by 8
The x-intercept is 7. Its coordinates are (7,0).
Step 2: Find the y-intercept.
The y-intercept is on the y-axis, where x=0. Plug x=0 into the equation and solve for the y-intercept y.
8x–7y = 56
8(0)–7y = 56 Plugin x=0
–7y = 56 Simplify
y–8 Divide both sides by –7
The y-intercept is–8 Its coordinates are (0,–8).
Step 3: Use the intercepts to graph.
Plot the x-intercept (7,0) and the y-intercept (0, –8). The graph is the straight line connecting them.
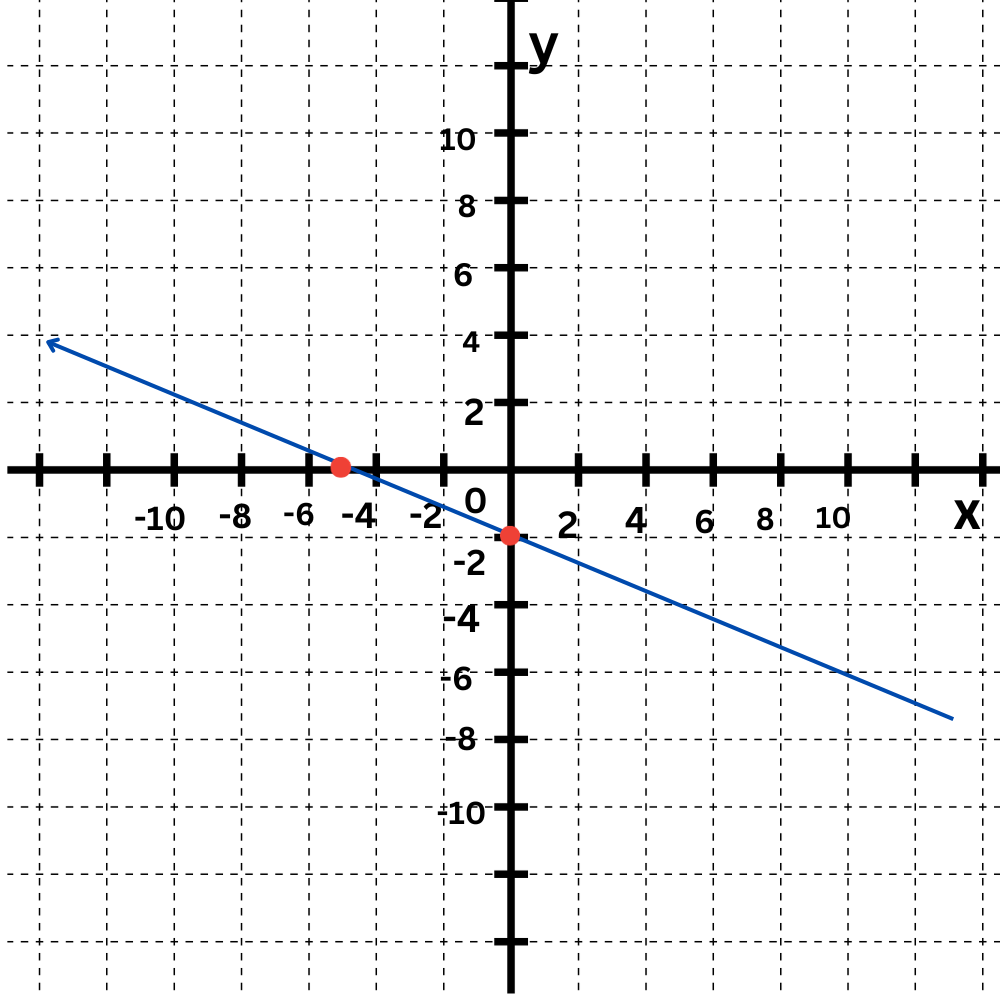
Graph this line using intercepts:
2x+5y=–10
Click to select points on the graph.
Step 1: Find the x-intercept.
The x-intercept is on the x-axis, where y=0. Plug y=0 into the equation and solve for the x-intercept x.
2x+5y=–10
2x+5(0)=–10 Plugin y=0
2x–10 Simplify
x–5 Divide both sides by 2
The x-intercept is –5. Its coordinates are (–5,0).
Step 2: Find the y-intercept.
The y-intercept is on the y-axis, where x=0. Plug x=0 into the equation and solve for the y-intercept y.
2x+5y=–10
2(0)+5y=–10 Plugin x=0
5y–10 Simplify
y–2 Divide both sides by 5
The y-intercept is–2 Its coordinates are (0,–2).
Step 3: Use the intercepts to graph.
Plot the x-intercept (–5,0) and the y-intercept (0,–2). The graph is the straight line connecting them.
Let’s Practice!