Compare linear equations, graphs, and tables
key notes:
What is a Linear Relationship?
A linear relationship shows a constant rate of change between two variables.
It can be represented in three main ways:
- Equation – Algebraic form (e.g., y=2x+3)
- Graph – A straight line on a coordinate plane
- Table – A set of ordered pairs (x,y) showing the relationship
Forms of a Linear Equation
- Slope-Intercept Form:
y=mx+b
- mmm = slope (rate of change)
- bbb = y-intercept (where the line crosses the y-axis)
Standard Form:
Ax+By=C
Can be converted to slope-intercept form to compare easily
How to Compare Using Equations, Graphs, and Tables
A. Compare Slope (m)
- In equation: Look directly at mmm in
y=mx+b
- In graph: Choose two points, use formula:
m=change in y/change in x – y2-y1/ x2-x1
- In table: Check how much y changes when x increases by 1.
B. Compare Y-Intercept (b)
- In equation: Look directly at bbb.
- In graph: Find where the line crosses y-axis (x = 0).
- In table: Look for the value of y when x = 0.
Worked Examples
Example 1 – Compare from Equations
Equation 1: y=2x+5
Equation 2: y=2x−3
- Slopes: both m=2→ lines are parallel (same steepness).
- Intercepts: 5 vs -3 → different starting points on y-axis.
✅ Lines have same slope, different intercepts → parallel lines.
Example 2 – Compare from Graphs
If one line rises faster than another when moving left to right, it has a larger slope.
If lines cross y-axis at different points, they have different y-intercepts.
Example 3 – Compare from Tables
| x | y₁ | y₂ |
|---|---|---|
| 0 | 4 | 1 |
| 1 | 6 | 3 |
| 2 | 8 | 5 |
- Slope for y1: increase by 2 each time x increases by 1 → slope = 2.
- Slope for y2: also increase by 2 → slope = 2.
- Intercept for y1 = 4, for y2= 1.
✅ Same slope, different intercepts → parallel.
Common Observations When Comparing
- Same slope, different intercept → parallel lines.
- Different slope → lines intersect at one point.
- Same slope and intercept → same line (overlapping).
Practice Questions
- Compare y=3x+1 and y=3x−4
- Compare the lines with points (0, 2) & (2, 6) and (0, 1) & (2, 7).
- From the table:
| x | y₁ | y₂ |
| – | — | — |
| 0 | 5 | 7 |
| 1 | 8 | 9 |
| 2 | 11 | 11 |
Compare slopes and intercepts.
Learn with an example
Function A and Function B are linear functions.
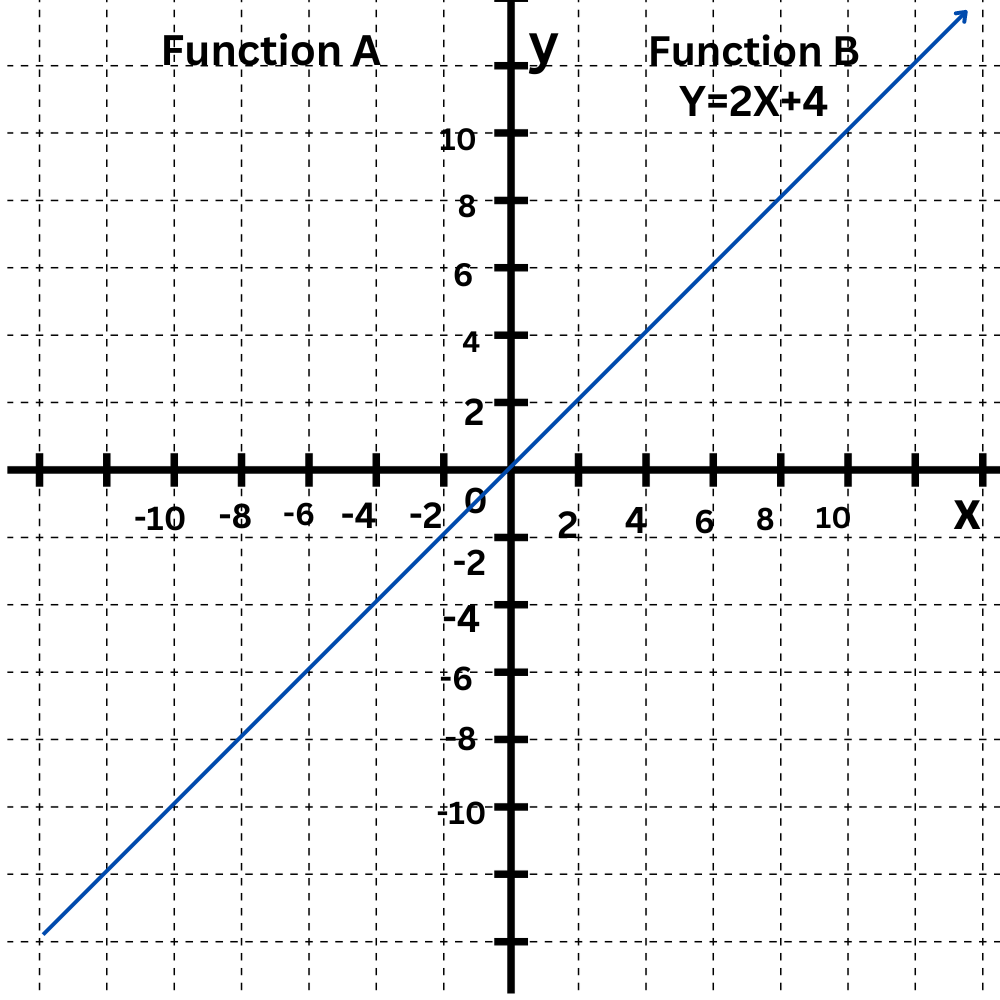
Which statement is true?
- The slope of Function A is greater than the slope of Function B.
- The slope of Function A is less than the slope of Function B.
Find the slope of Function A.
The graph of a linear function is a line. Find the change in y and the change in x between any two points on the line.
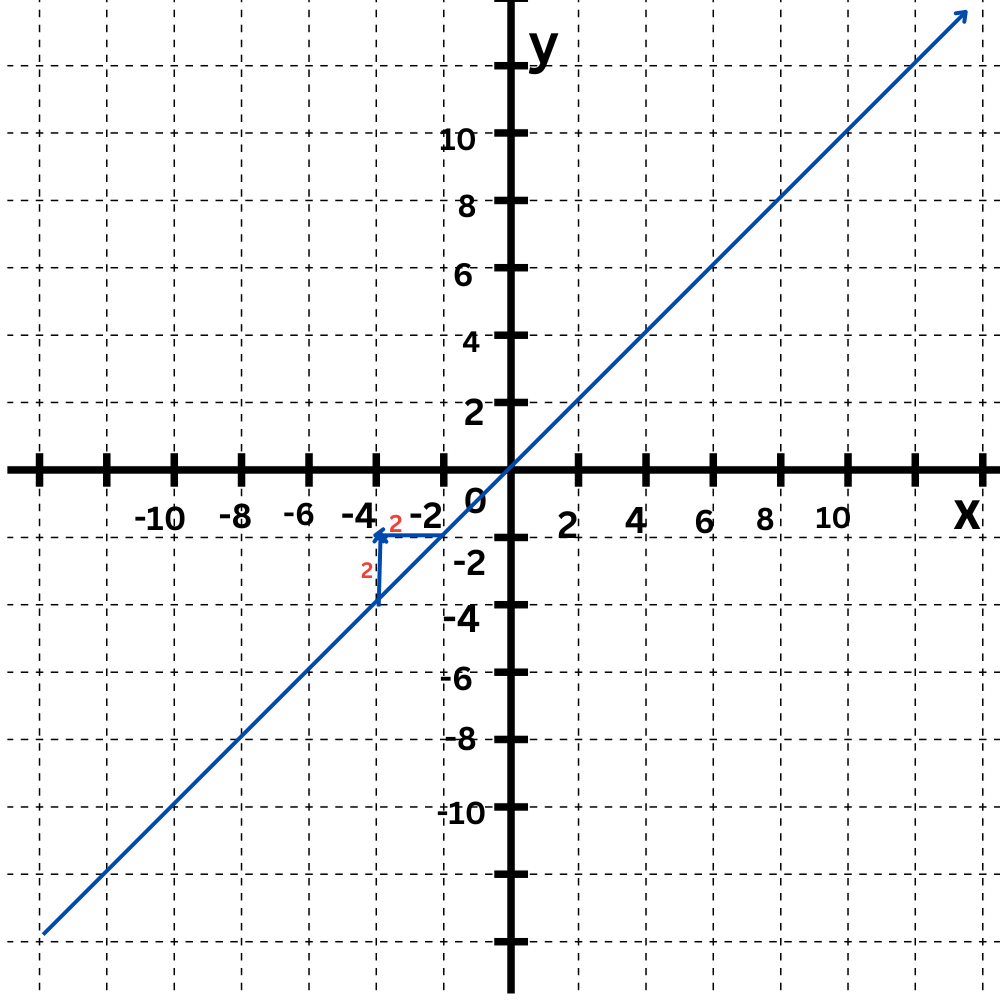
The change in y is 2, and the change in x is 2.
The slope is:
m = change in y / change in x
m = 2/2
m = 1
Find the slope of Function B.
The equation is in slope-intercept form, y=2x+4.
So, the slope is 2.
Compare the slopes.
The slope of Function A is 1. The slope of Function B is 2.
So, the slope of Function A is less than the slope of Function B.
Function A and Function B are linear functions.
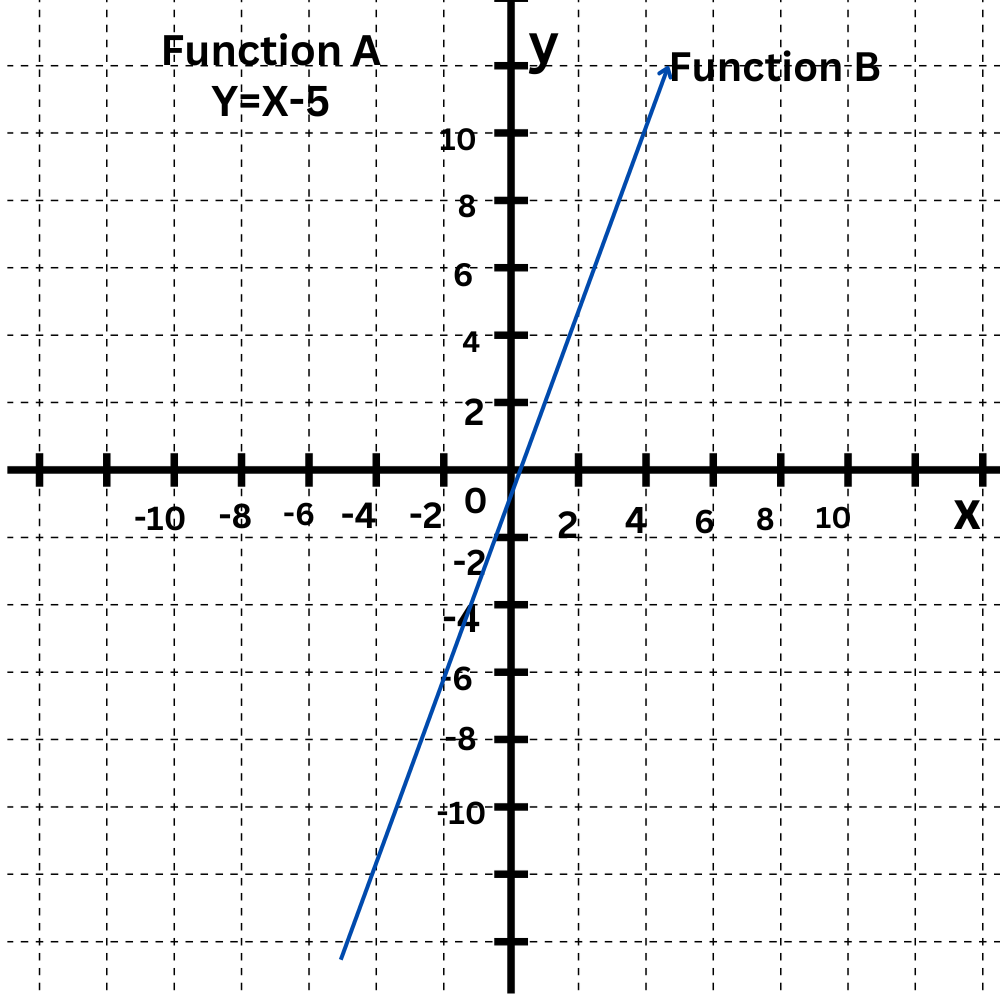
Which statement is true?
- The slope of Function A is greater than the slope of Function B.
- The slope of Function A is less than the slope of Function B.
Find the slope of Function A.
The equation is in slope-intercept form, y=x–5.
Since y=x–5 is the same as y=1x–5, the slope is 1.
Find the slope of Function B.
The graph of a linear function is a line. Find the change in y and the change in x between any two points on the line.
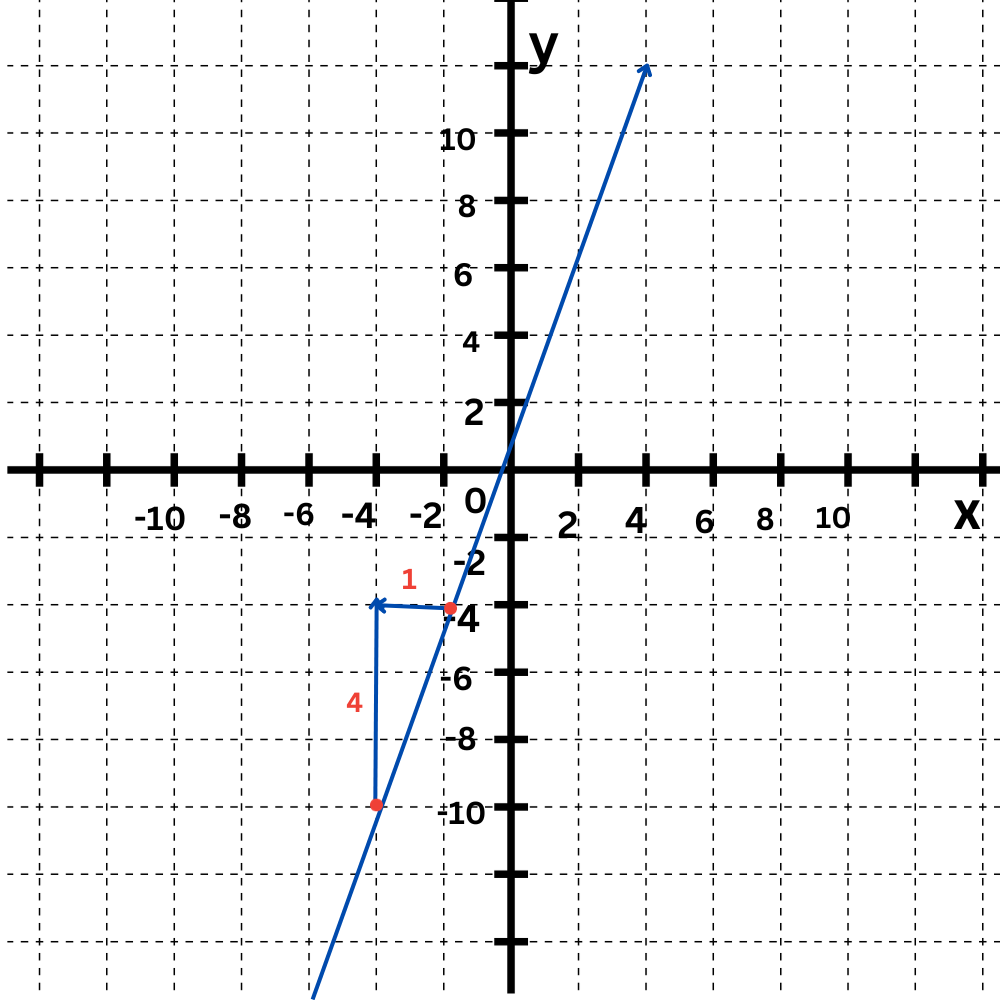
The change in y is 4, and the change in x is 1.
The slope is:
m = change in y / change in x
m = 4/1
m = 4
Compare the slopes.
The slope of Function A is 1. The slope of Function B is 4.
So, the slope of Function A is less than the slope of Function B.
Let’s Practice!