Graph a proportional relationship
Key Notes:
Proportional Relationships
- A proportional relationship is a relationship between two quantities that can be expressed as a constant ratio or rate.
- In other words, if two quantities are proportional, their ratio remains constant.
Graphing Proportional Relationships
- When graphed, a proportional relationship forms a straight line passing through the origin (0, 0).
- The slope of the line represents the constant of proportionality.
Steps to Graph a Proportional Relationship:
- Identify the constant of proportionality: Find the constant ratio between the two quantities.
- Plot the origin: Plot the point (0, 0) on the coordinate plane.
- Use the constant of proportionality to find additional points: Choose a value for one of the quantities and multiply it by the constant of proportionality to find the corresponding value of the other quantity. Plot the point representing this pair of values.
- Draw a line: Draw a straight line passing through the origin and the point you plotted.
Example:
Consider the proportional relationship y = 2x.
- The constant of proportionality is 2.
- Plot the point (0, 0).
- Choose a value for x, such as x = 3. Multiply it by the constant of proportionality: y = 2 * 3 = 6. Plot the point (3, 6).
- Draw a straight line passing through (0, 0) and (3, 6).
Key Points to Remember:
- A proportional relationship forms a straight line passing through the origin when graphed.
- The slope of the line represents the constant of proportionality.
- To graph a proportional relationship, plot the origin and use the constant of proportionality to find additional points.
Learn with an example
Graph this function:
y=2x
Click to select points on the graph.
Find ordered pairs by plugging in values for x.
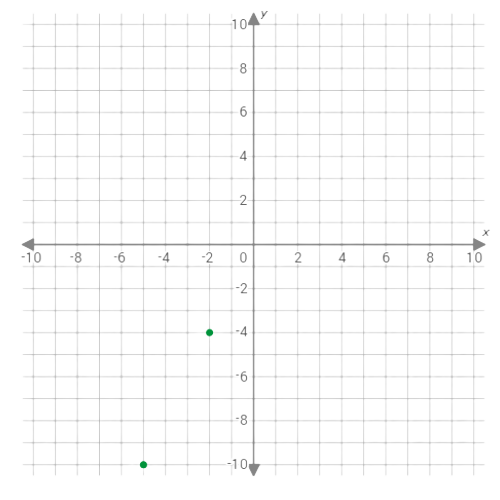
Plug in x=–5.
y=2x
=2(–5)
=–10
The point (–5,–10) is on the graph.
Plug in x=–2.
=2x
=2(–2)
=–4
The point (–2,–4) is on the graph.
Plot the points (–5,–10) and (–2,–4) on the graph.
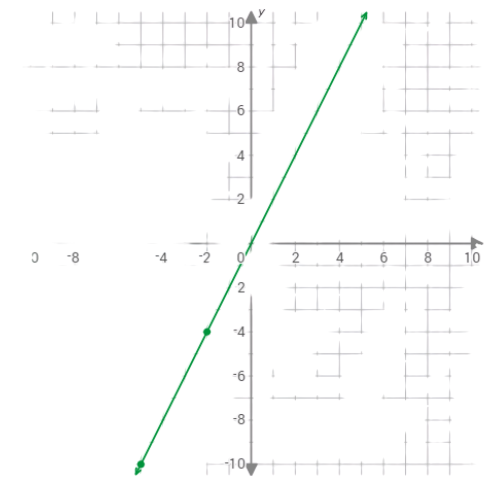
The graph of the function y=2x is the straight line connecting the points (–5,–10) and (–2,–4).
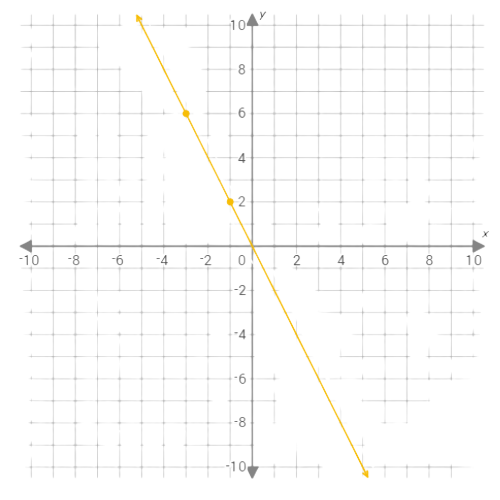
Graph this function:
y=–2x
Click to select points on the graph.

Find ordered pairs by plugging in values for x.
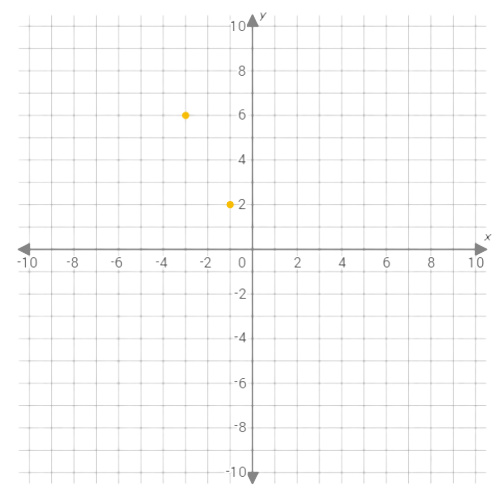
Plug in x=–3.
y=–2x
=–2(–3)
=6
he point (–3,6) is on the graph.
Plug in x=–1.
y=–2x
=–2(–1)
=2
The point (–1,2) is on the graph.
Plot the points (–3,6) and (–1,2) on the graph.
The graph of the function y=–2x is the straight line connecting the points (–3,6) and (–1,2).
Graph this function:
y=–2x
Click to select points on the graph.
Find ordered pairs by plugging in values for x
Plug in x=–1.
y=–2x
=–2(–1)
=2
The point (–1,2) is on the graph.
Plug in x=2.
y=–2x
=–2(2)
=–4
The point (2,–4) is on the graph.
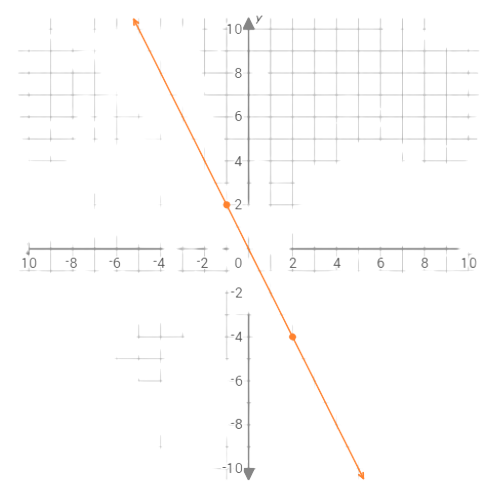
Plot the points (–1,2) and (2,–4) on the graph.
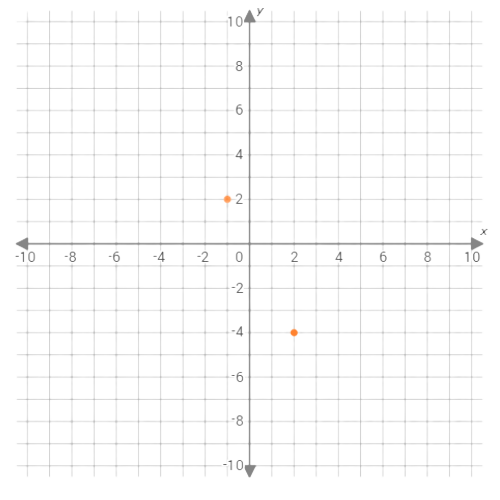
The graph of the function y=–2x is the straight line connecting the points (–1,2) and (2,–4).
let’s practice!